They key to sustaining a healthy business (whether in a pandemic, a recession, or even a period of growth) is data – and we don’t mean just checking your P&L at the end of every month. Setting goals, tracking key metrics, and seeing your hits and misses with products, overhead, and savings can be a huge differentiator for business owners.
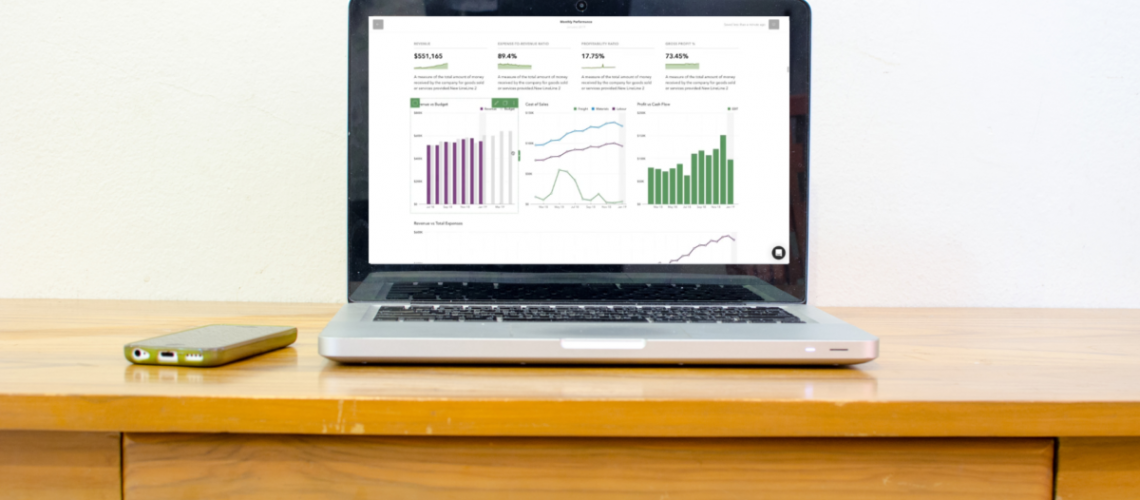
A new software we’ve discovered to help business owners do this is called Fathom. It is designed to help small-to-mid -sized business owners more easily understand what is going on in their financials. In just a few minutes, you can plug in your business’s financial data – it integrates directly with your accounting software (like QBO, Xero, or even an Excel spreadsheet) – then it provides a visual representation of the past, present, and projected future of your business. Seeing your data in charts and graphs instead of lines of numbers gives you the confidence to not only spot problems, but also opportunities using these four tools:


Interactive Analysis Tools
The Financial Analysis tools help you track and visualize your business’s performance. We can work with you to set up Fathom in a way that allows you to run different scenarios and explore strategies for improving performance.
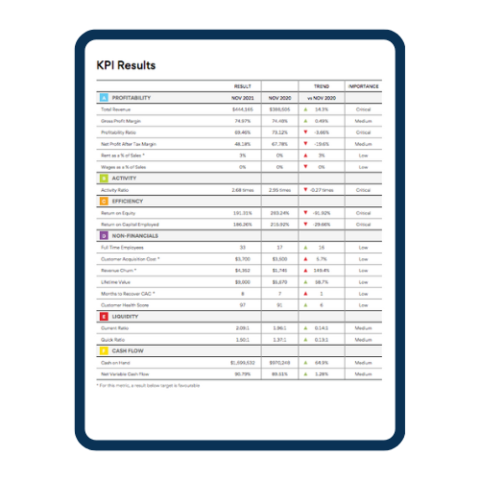
KPI Tracking: One of our favorite ways to use the Financial Analysis tool is to highlight your business Key Performance Indicators (KPIs) to focus on different levels of performance such as profitability and cashflows. Fathom has over 70 KPIs and ratios, so you can track what is most important to you and your business – this includes anything from a GL code to a class or location – you will simply select what you want to track, and Fathom does the rest. (P.S. If Fathom doesn’t already have a formula for something you’d like to see, we can create one for you within the software!)
Non-Financial Tracking: You can also track non-financial metrics, such as staff hours worked or monthly website visits. When combined with your financial data, this provides a more comprehensive look at the performance of your business.
Sharing: Because these tools are interactive, they are great for meetings with your board or investors. You can also choose to share certain reports with your team to show them updated results at any time.
Forecasting with Fathom
Fathom also provides three-way cashflow forecasting, which gives you a way to confidently look to the future. You’ll import your historical data and the forecast is created via a statistical model, which is updated live from your accounting software each day. You can create customized reports to show a rolling series that combines actual and future results.
You can go a step further and manage your forecast by seeing the effects of future business events you anticipate such as hiring an employee, buying an asset, or getting a loan. You can make adjustments to these events to see the potential impact of the various decisions, including timing, different costs, loan terms, etc. As you make these adjustments, you will see the forecast immediately shift to give you feedback on your plans.
Watch this video to see some examples.
Visuals & Reports
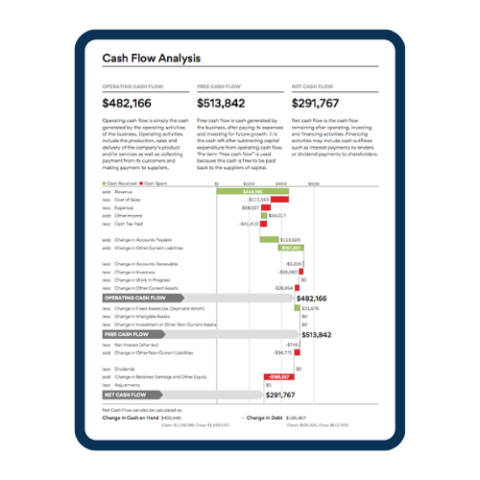
The visuals and reports are easy to understand. Because of the graphs and charts, you’ll be able to quickly identify trends and patterns. This is where you will gain critical insights that would otherwise be lost when looking at hundreds of rows of spreadsheets. We can help you generate reports for you to use internally or for you to present to your investors, banks, or board of directors.
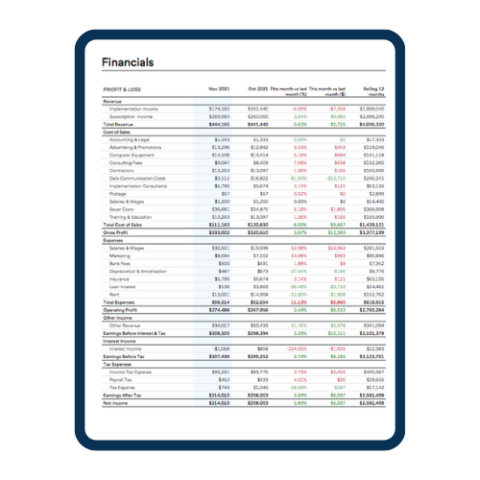
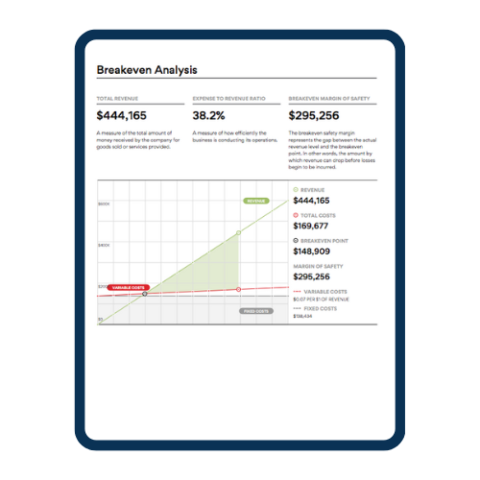
If you decide to create your own reports, Fathom offers pre-built templates or you can build your report from scratch. Either way, the editor allows you to quickly add text, charts, and financial statements in a few simple clicks. The reports can be branded to your business allowing you to have personalized professional reports that you are proud to show to others. When creating an executive summary, you can use placeholders that pull financial data into your report without having to go back and look at it. Once you have created your report and you are ready to share it, you can schedule the reports to be sent to your team directly from the software. Here are a few examples of report pages.
Include Fathom in your CAS Cloud
We are thrilled to be offering this option to our clients. Since we started rolling it out earlier this year, the feedback has been overwhelmingly positive. If you are a business owner who is looking for ways to define goals and create a strategy for growth, please contact us to get started with Fathom. We will set up a meeting to determine your goals and then help you get your data imported, show you how to select items to track, and help you interpret and understand your reports.

Hayley Lowe
Hayley is an Analyst who works with our CAS, assurance, and tax teams. She has a natural talent for finding efficiencies in processes and integrating software to assist in that. Hayley has been with Avizo for a little over a year and is working on earning her CPA designation.

